Envisioning Alternative Course and Program Portfolios
 The importance of envisioning future course and program portfolios will be familiar to readers of my recent blogs. Provosts, deans, and others responsible for academic resourcing invest time and money to get better data on their portfolios: e.g., by using Gray Associates’ Program Economics Platform (PEP). These data help them identify strategies for improvement, which is especially important given the current Covid-19 disruptions. We are pleased to introduce PEP+, our new predictive model for envisioning the consequences of changing a school’s lineup of courses and programs, just in time to help mitigate these disruptions.
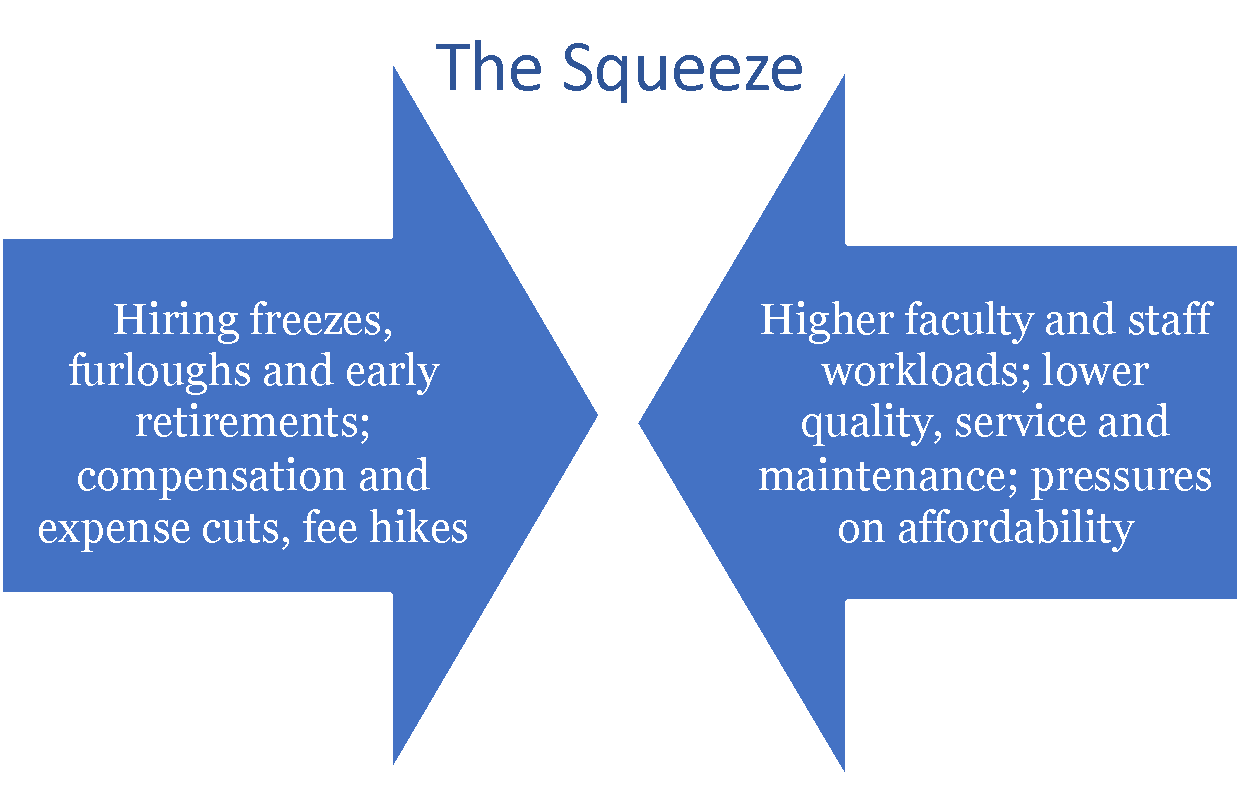
The common responses are, alas, only too well known. The typical approach, depicted in this diagram adapted from a previous blog, extracts money by squeezing people, facilities and other resources. Unfortunately, though, the new situation may be no more acceptable than the original one when the effects on operations are considered. The challenge is not just to close the budget gap but to survive as the healthy institution you want to be—one that is both operationally and financially sustainable while maintaining quality and affordability.
Mitigating the squeeze requires one to address the fundamental drivers of revenue, cost and faculty workload. For teaching, these are the institution’s students, programs, courses, and departmental faculty and other resources—all factors that are addressed by the new predictive models. (For a detailed description of the genre, see chapter six of my Resource Management for Colleges and Universities.) The models allow university leaders to envision and test alternative portfolio configurations and departmental resourcing strategies; that is, to do “what-if” analyses. The what-ifs facilitate the search for actions that will close the financial gap without stressing operational sustainability. Research can be included as well, for schools where that’s a significant objective.
To understand the predictive model’s benefits, we must look at the new information it gives us. I will describe the new Economic tool I am building with Gray, which, while still a work in progress, already offers the ability to envision changes to program and course portfolios. It’s based on historical PEP, which provides highly granular views of the operational and financial variables associated with teaching—down to the level of enrollment in specific course sections by students in particular programs. (Variables include average class size, instructor types, gross and net tuition revenue, direct cost, and contribution margin.) This granularity enables the prediction of how enrollment and resourcing changes affect departmental operations and the direct economics of teaching.
Imagine that!
Plus a substantial gap-closing target has been assigned to the academic areas. The provost wants to consider whether to sunset certain programs to reduce workload or expand others (probably in areas where there is more capacity) to boost revenue. But how will they affect costs and margins? Without going into the details, it’s clear that finding a good gap-closing strategy requires predicting the changes in revenues, costs and operational stress for alternative actions. Space permits only a couple of illustrations, but they are sufficient to demonstrate that such predictions involve more surprises than might be expected.
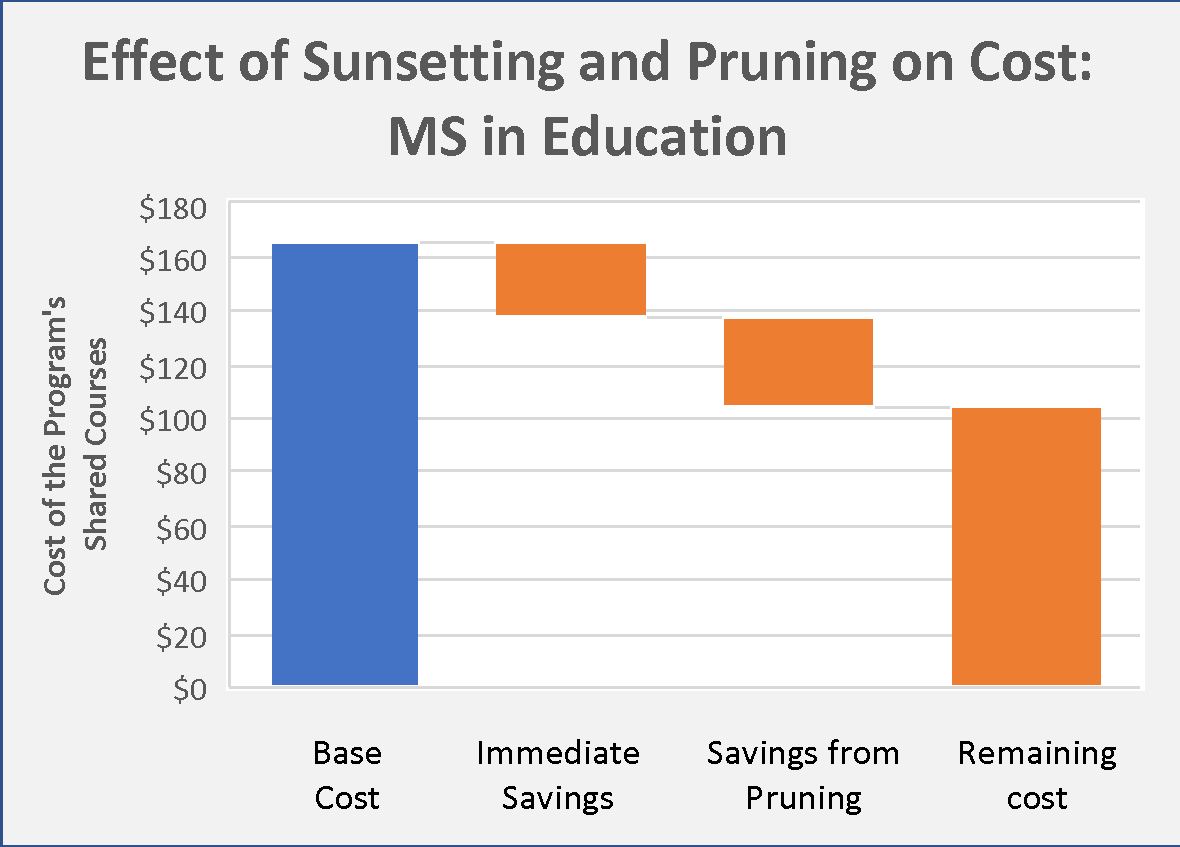
Example 1 concerns the savings from “sunsetting” programs. Predicting the savings might sound easy: simply multiply the reduction in credit hours taught by the program’s average cost per credit hour as calculated from the aforementioned historical model.
Wrong! The above produces a good “base cost” estimate but it does not reflect what actually will happen. The following chart shows how eliminating the MS in Education at a certain (actual) institution produces an immediate saving of only about 15% of base cost. (This is because only a few class sections would lose all their students.) Another 20% could be saved by pruning courses where enrollment has dropped below policy threshold—in this case, 6 students. (The model identifies the departments where the pruning should take place.) This leaves almost two-thirds of the cost in place, whereas 100% of the revenue brought in by the excised credits is lost. And because workloads are correlated with class sections and thus with cost, the reduction in operational stress would not be large. The situation is even more extreme for the BS in Anthropology (not shown), which shares more courses with other programs. Both the immediate savings and opportunities for follow-on pruning are negligible, which leaves nearly all of the cost and workload in place.
Example 2 addresses program expansion. These results also are surprising, but in a good way. The chart shows the incremental cost associated with adding students to the two programs considered above and compares it with estimates based on average cost per credit hour. Adding 160 students adds about $550,000 of incremental cost to Anthropology, which is only 58% of the cost calculated using the program’s average cost. (Anthropology courses tend to be more expensive than the out-of-department courses, such as gen-ed, that their students take.) For the MS in Education, the incremental cost is $200 or 62% of average cost. Some readers may wonder why the cost of BS Anthropology, with an intake of only 27 students, is larger than that of MS Education with its intake of 68 students. The answer is that an admitted BS student takes 412 times as many credit hours as required for the MS.
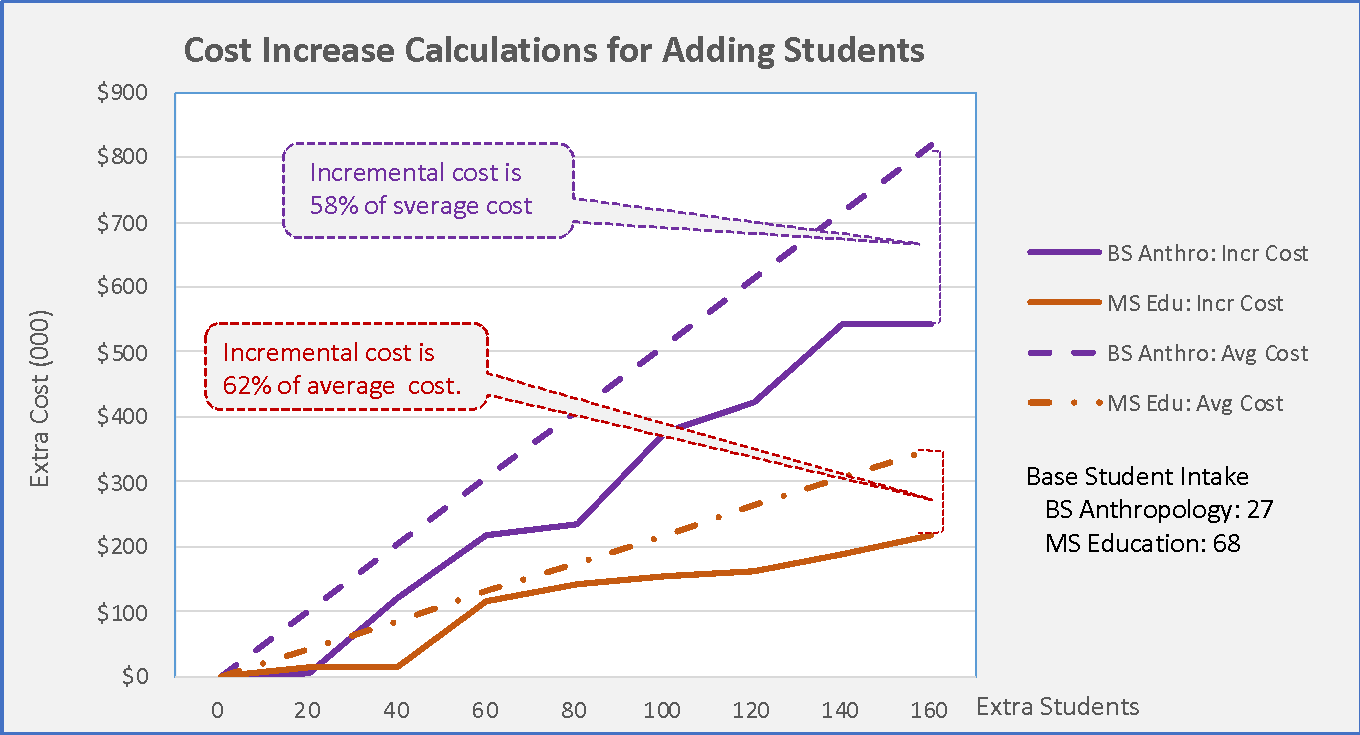
The existence of discreet sections means the incremental costs are not smooth curves. For example, the first 20 to 40 additional students hardly affect cost at all because most of the new students are accommodated within the existing roster of class sections. The revenue contributions are proportional to credit hours, so adding students is a good deal financially. However, one still must check the teaching workloads and make sure the additional students won’t require large increases in support services and administration.
These situation-specific results are difficult to calculate on spreadsheets, but they are a standard output from a predictive model such as Gray’s Economic tool . What-ifs can be calculated in real time, even in an actual planning meeting. I hope I’ve demonstrated why I think these predictive models are game-changers and that their capabilities and advantages will only increase over time.
Share This Post
Comment
Published at Tue, 06 Apr 2021 19:43:44 +0000
Article source: https://www.grayassociates.com/blog/envisioning-alternative-course-and-program-portfolios