Predictive Models for Academic Resourcing

University leaders are seriously planning for the post-COVID world. This world will differ significantly from the old, familiar one. The possibilities for restructuring academic activities are increasing dramatically as graduate employment patterns shift and faculty and students accept new modes of digitally mediated instruction. Bob Atkins’ recent blog, “Higher Education: Are You Ready for the Economic Boom?“ speaks to the opportunities available to institutions that are prepared to launch “different types of programs.”
But launching different types of programs brings its own disruptions and uncertainties. Bob focused on demand and competition, but the university’s internal operations also face significant challenges. My own recent blog, “Envisioning Alternative Course and Program Portfolios,” describes Gray’s new analytics for changing the mix of currently offered programs to boost mission relevance and margins. This blog applies the analytics to planning for “new and different” programs.
Predictive Analytics
 As announced a few weeks ago, the predictive model helps planners forecast how curricular changes will impact revenues, costs, margins, and mission contributions—not simply in the initiating department, but across the institution.
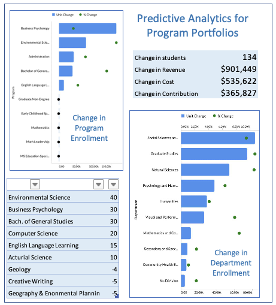
Here is a summary of the dashboard for a typical application. The inputs that specify this what-if scenario appears at the lower left: forty students added to Environmental Science, thirty to Business Psychology, etc., down to reductions by five students each for Creative Writing and Geography & Environmental Planning. No changes were made to other dozen or so programs (not shown).
Aggregate results from the what-if are displayed in the upper right-hand panel. The change of +134 students boosts revenue by $901,449 and increases directly variable costs by $535,662, for a margin increase of $365,825. The remaining panels show the absolute and percentage changes (bars and dots, respectively) for the programs and departments that are materially affected by these changes. Looking at the departmental results, we see that Social Sciences, Graduate Non-Degree, and Natural Sciences absorb the lion’s share of the changes in course enrollment—and thus of costs and revenues.
“Directly variable costs” can include adjunct and other short-term contractual staff, stipends for extra faculty teaching, and expendable materials and supplies. Regular faculty FTEs remain constant (although their cost allocation among courses will shift somewhat). Teaching loads will change, however, and this may motivate follow-on adjustments to departmental faculty rosters—in this case, the addition of FTEs to departments where enrollments will increase. The departmental calculations are fairly straightforward, but they are beyond our scope here.
The calculations that drive the dashboard depend on an empirically grounded structural model of the teaching process. As implemented in Gray’s Program Economics Platform, the model recognizes that a given program shares courses with other programs, many of which are taught by departments outside the major (“course overlap”), and that much faculty contact is with groups of students (“class sections”) rather than one-on-one. Program enrollment changes cascade through many departments, but not necessarily in a proportional way. For example, adding or subtracting enrollments in a given course may or may not change the number of class sections required, which produces differential impacts on directly variable cost. Examples can be found in my “Envisioning…Portfolios” blog.
Application to New Programs
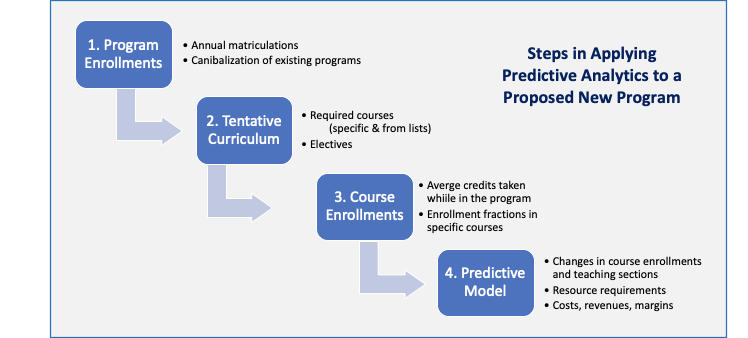
Predictions also can be made for proposed new programs, even ones with different structures from existing ones. Once the proposal has cleared the hurdles for mission contribution and market viability, the task is to prepare a “business plan” that describes how the new program would be implemented and predicts the operational and financial consequences. These tasks are depicted in the figure and described below.
1. Program enrollments. The use of market and competitive data to estimate new program matriculations is being discussed extensively, by Gray Associates and others, in workshops, webinars, and blogs. Therefore, I’ll assume for present purposes that such estimates are in hand. However, the possibility that new matriculations in one program may draw students away from other programs, and conversely, is seldom considered. My colleagues and I are studying such “cannibalization” and we expect to build it into our predictive analytic tools soon.
2. Design a tentative curriculum. Application of program economics models demonstrates quickly that one cannot predict the impact of a new program without knowing, at least approximately, which courses its students will take – not just in the major departments, but throughout the institution. Thus, the design of a tentative curriculum is a key step in new program evaluation. This should start with the required courses, both new and existing, plus options where students chose from an acceptable list. Electives cannot be detailed specifically, but lists of likely popular choices also should be drawn up at this stage. All this applies to general education, where applicable, as well as to courses directly feeding the major itself.
3. Course enrollments. Start by estimating the average number of courses (or credit hours) that will be taken by new program matriculants. Begin with the expected student load per year but include judgments about student dropouts and when they will occur. The resulting “expected number course enrollments or credit hours during a matriculant’s life in the program” (whether or not that student graduates) must then be assigned to the list of courses identified in Step 2. These judgments about how students will choose from the various lists may be rough, but they are an important element of new program planning whether or not predictive analytics is to be used.
4. Apply the predictive model. The data from the first three steps are sufficient to add the new proposal into the predictive analytics tool described above.
The use of predictive analytics puts new program planning onto a much firmer footing than does any previous approach. It considers likely consequences across the institution, takes account of course overlap and sectioning, and identifies departments where new faculty FTEs may need to be added. My colleges and I view this as an essential element of program evaluation and planning, especially for programs that are “new and different” from existing ones.
Share This Post
Comment
Published at Tue, 01 Jun 2021 21:08:47 +0000
Article source: https://www.grayassociates.com/blog/predictive-models-for-academic-resourcing